In April 2023, it became law for landlords to report TSMs to the Regulator of Social Housing.
There are 22 TSMs in total and they are split into two parts:
- 10 performance measures that are collected through management performance information
- 12 customer perception survey measures that are collected by surveying customers directly
This page sets out the scores that you gave us in 2024/25 and how staff are working together to improve the areas raised in the survey.
Thank you to the 619 customers who gave us feedback.
By anonymously sharing your honest opinions of our services, you are helping us to focus on the key areas that matter most to you – such as keeping our properties in good repair, respectful and helpful engagement, and responsible neighbourhood management. It is only with your help that we can improve our services for all of our customers.

Our approach to TSMs
How do we collect feedback from customers?
We use an independent organisation called Pexel to ensure all feedback is collected fairly and impartially. We do not target particular groups or leave anyone out when conducting the survey.
See the questions Pexel asked here
How many customers did we speak to?
A total of 619 surveys were completed across a range of tenants to ensure that the feedback we received would be representative of all our customers.
What are we comparing our results to?
While this is the second time we’re collecting official TSM data, we have been collecting customer feedback data in line with TSMs since 2023. This means we can see where improvements are being made year-on-year and where we might need to focus on in future.
How we performed
Overall, did Watford Community Housing score better this year than last year?
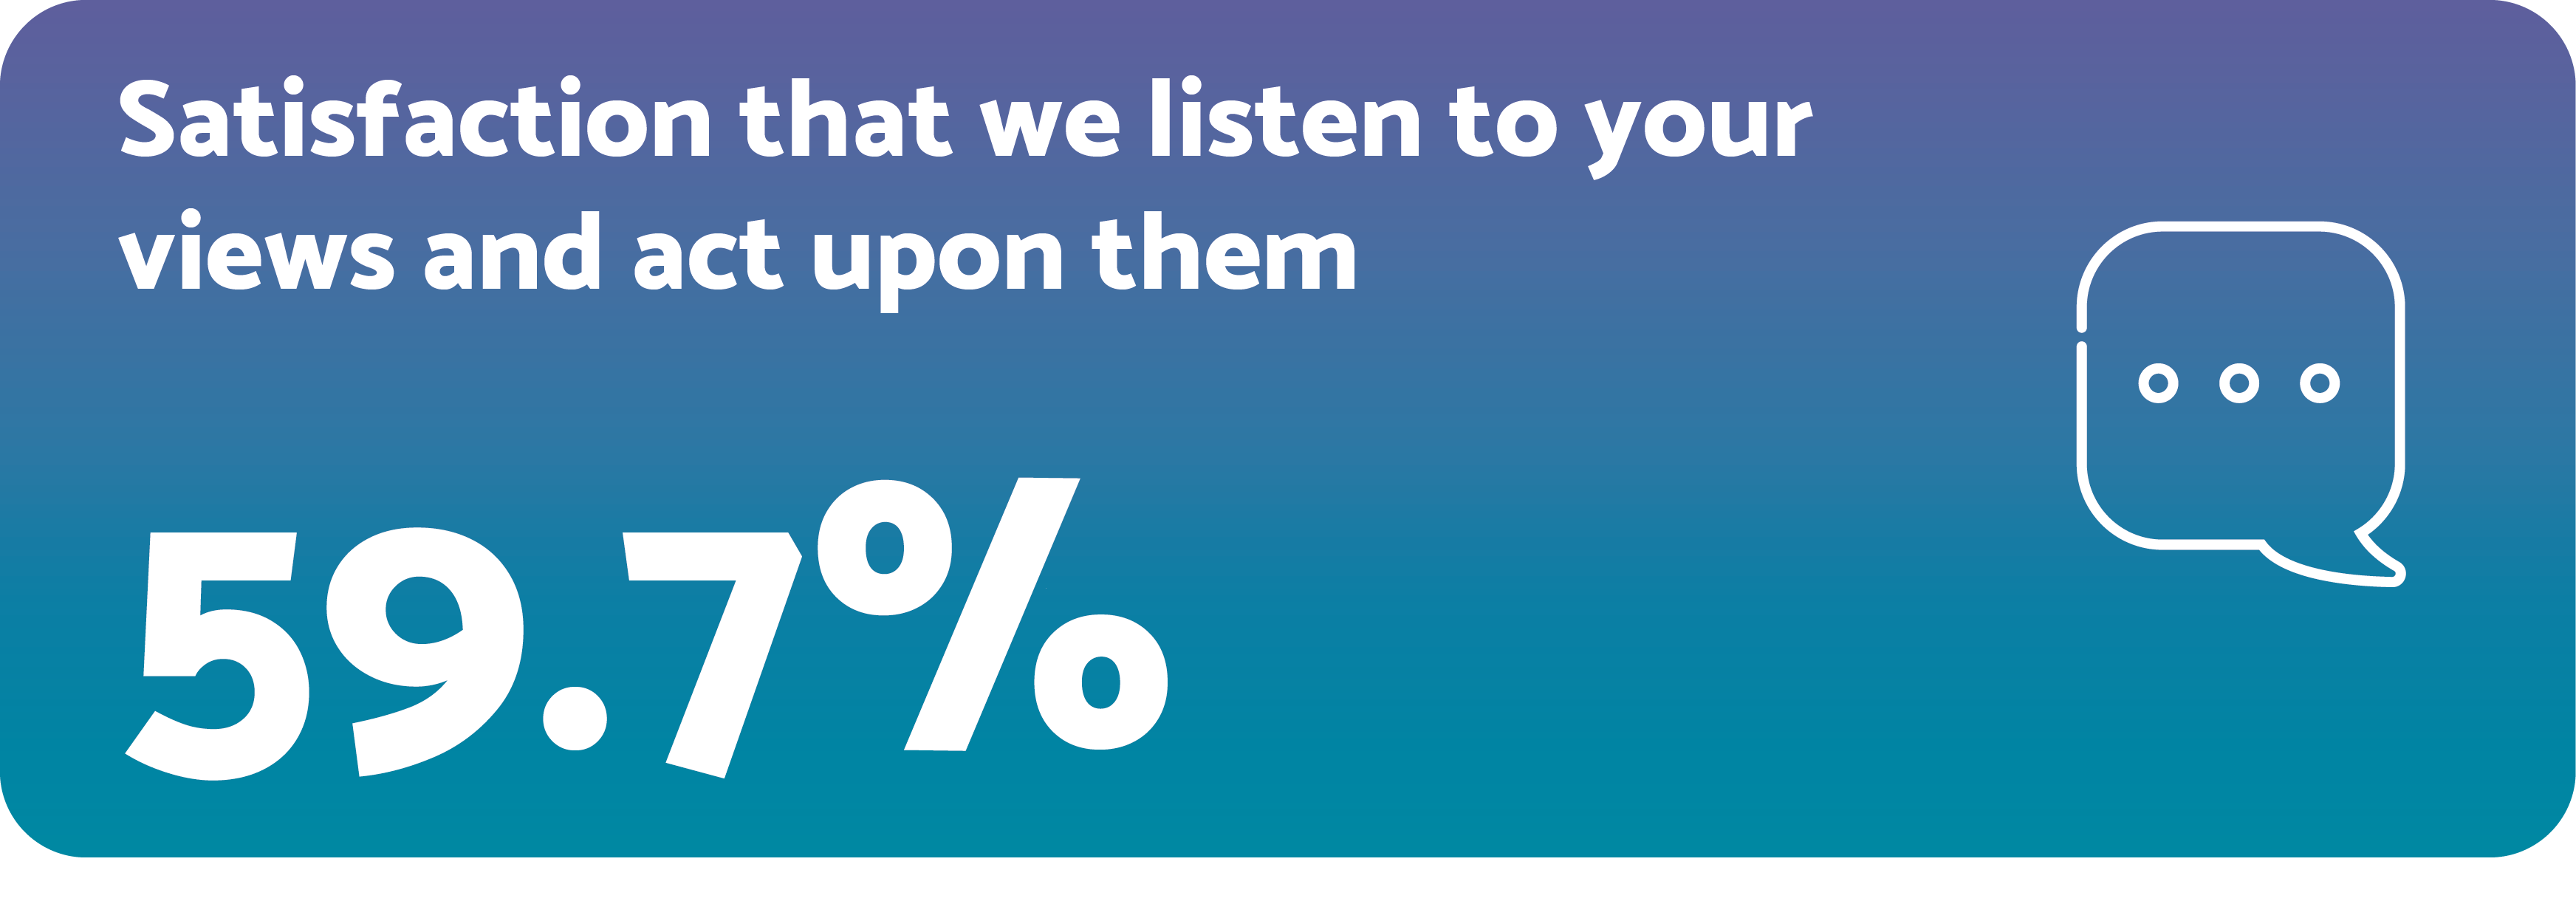
Our TSM scores improved in several key areas. Most notably in the level of overall satisfaction, which went from 71.2% in 2023/24 to 71.6% in 2024/25.
We’re proud of the work we’ve done to improve things for customers and we will continue to strive to improve scores across the board for next year.
Areas that saw the largest improvement from 2022/23 were:
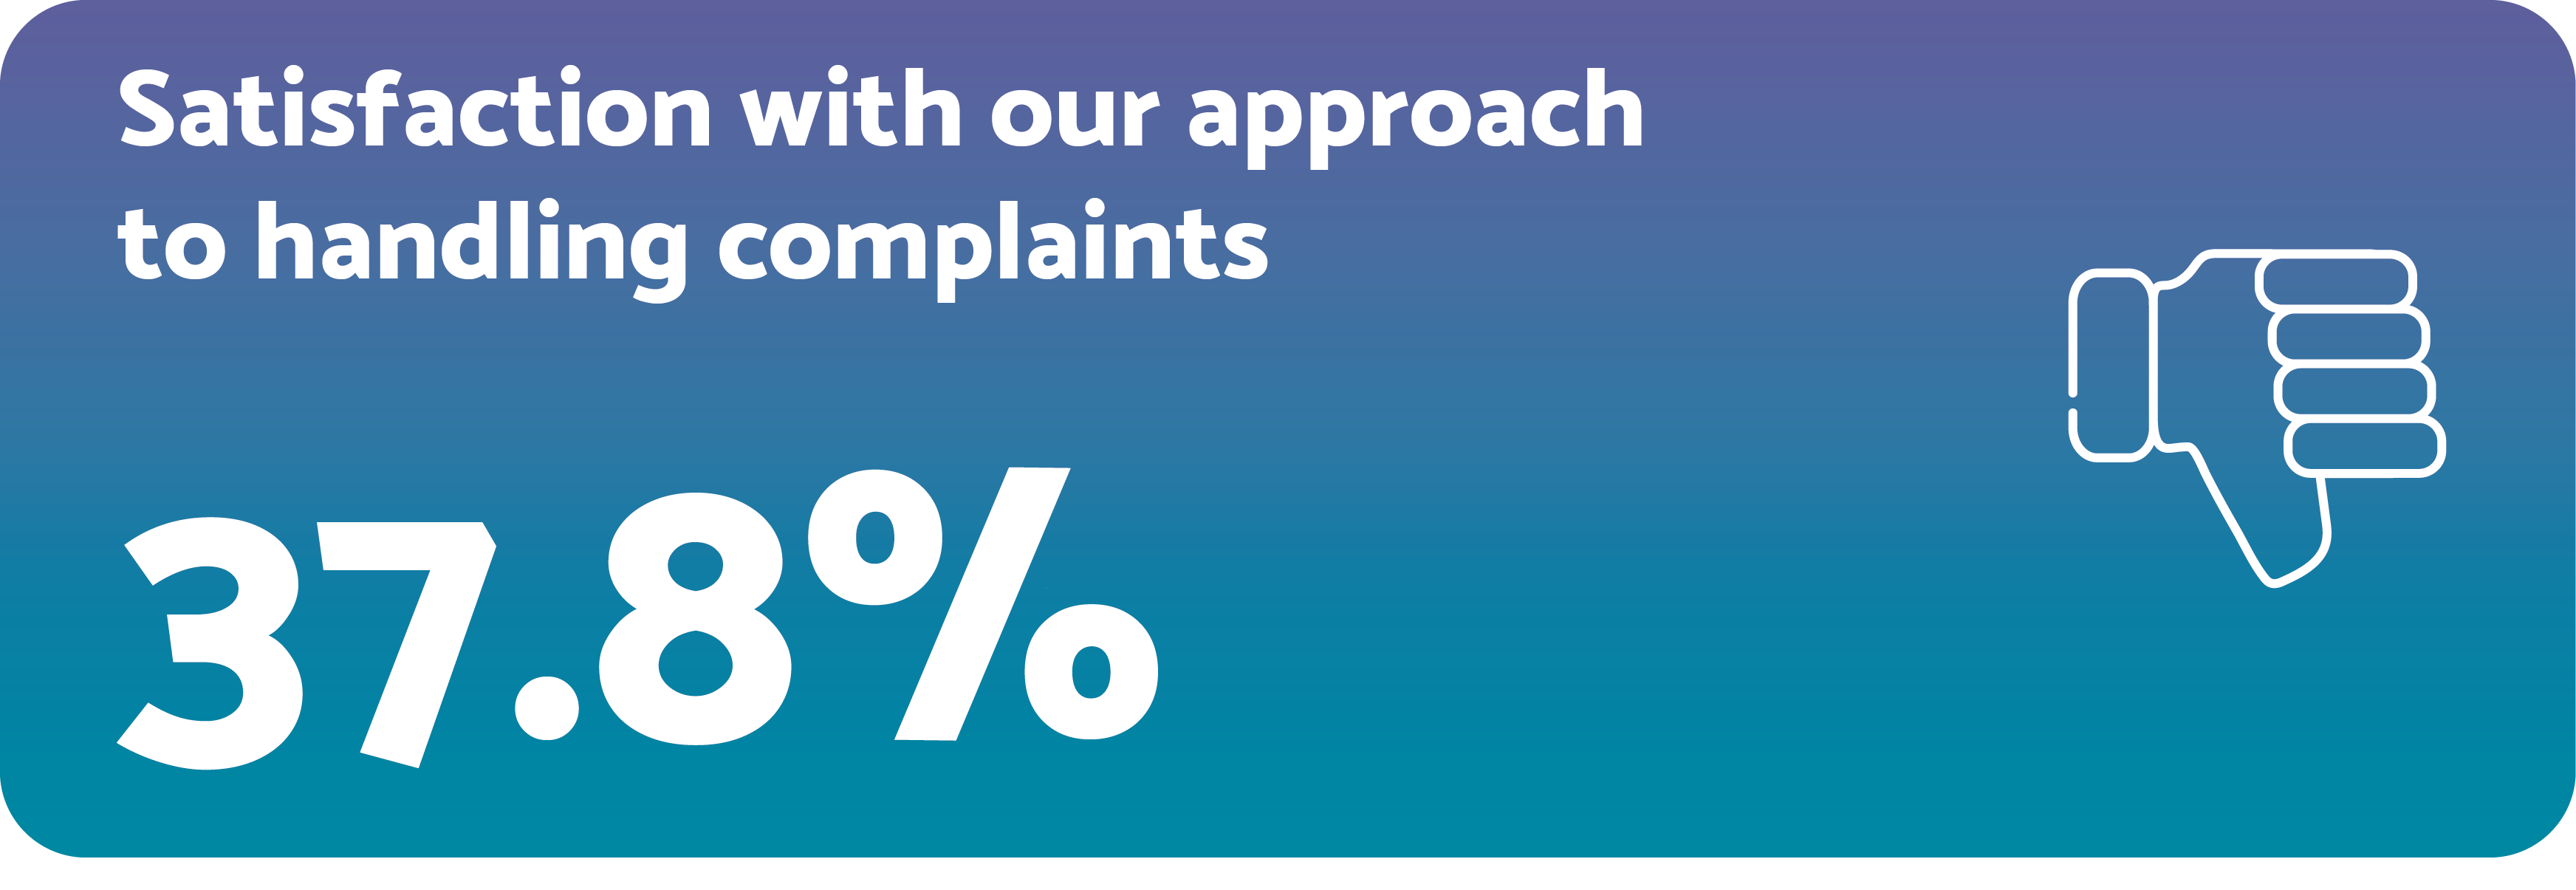
Complaint Handling +2.1%
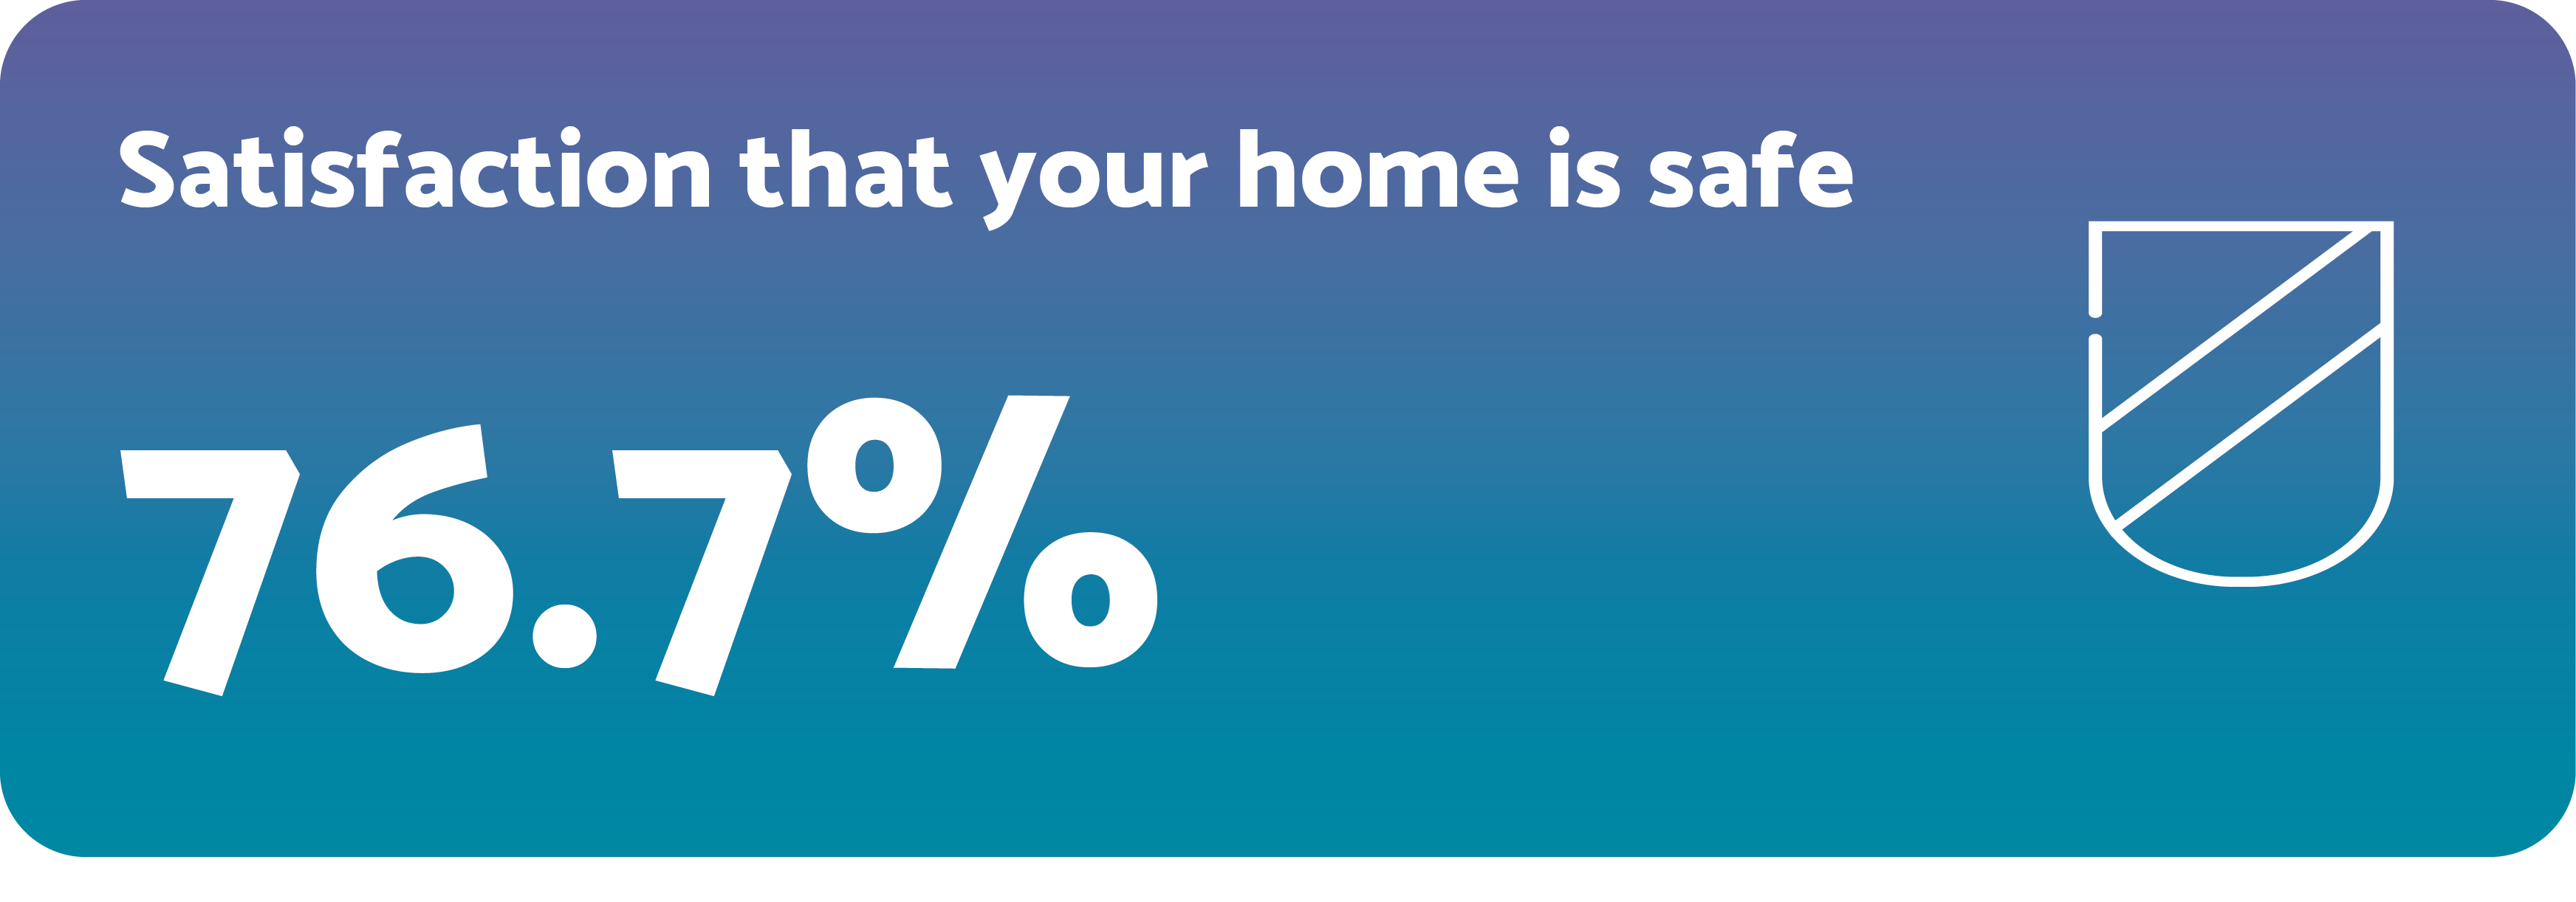
Home is safe +1.1%
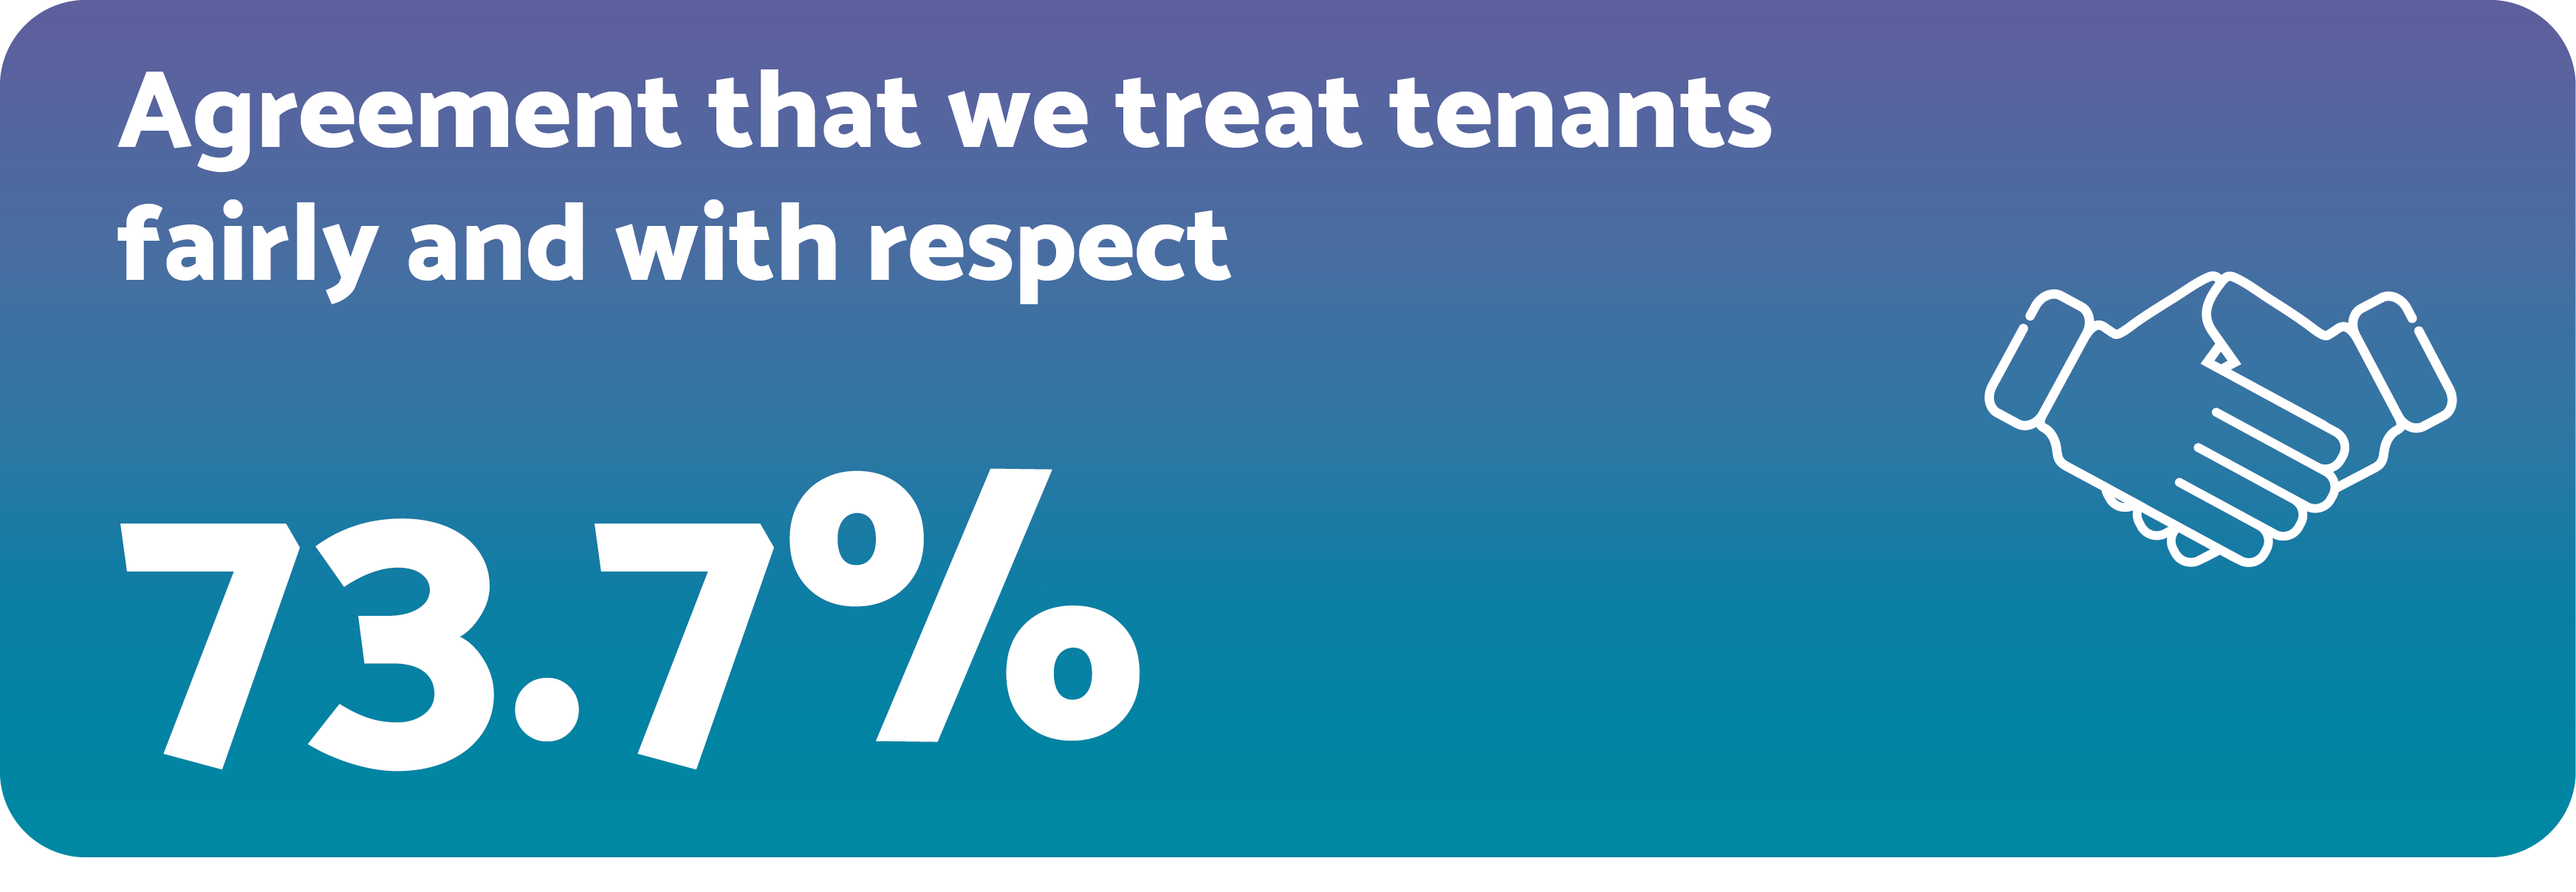
Treats fairly and with respect +0.2%
Where are we looking to improve?
We’re working to improve across all the areas measured by TSMs, but we are particularly focusing on those where we saw a decrease in the scores we recorded in 2024/25.
The main areas we’re looking to improve are:
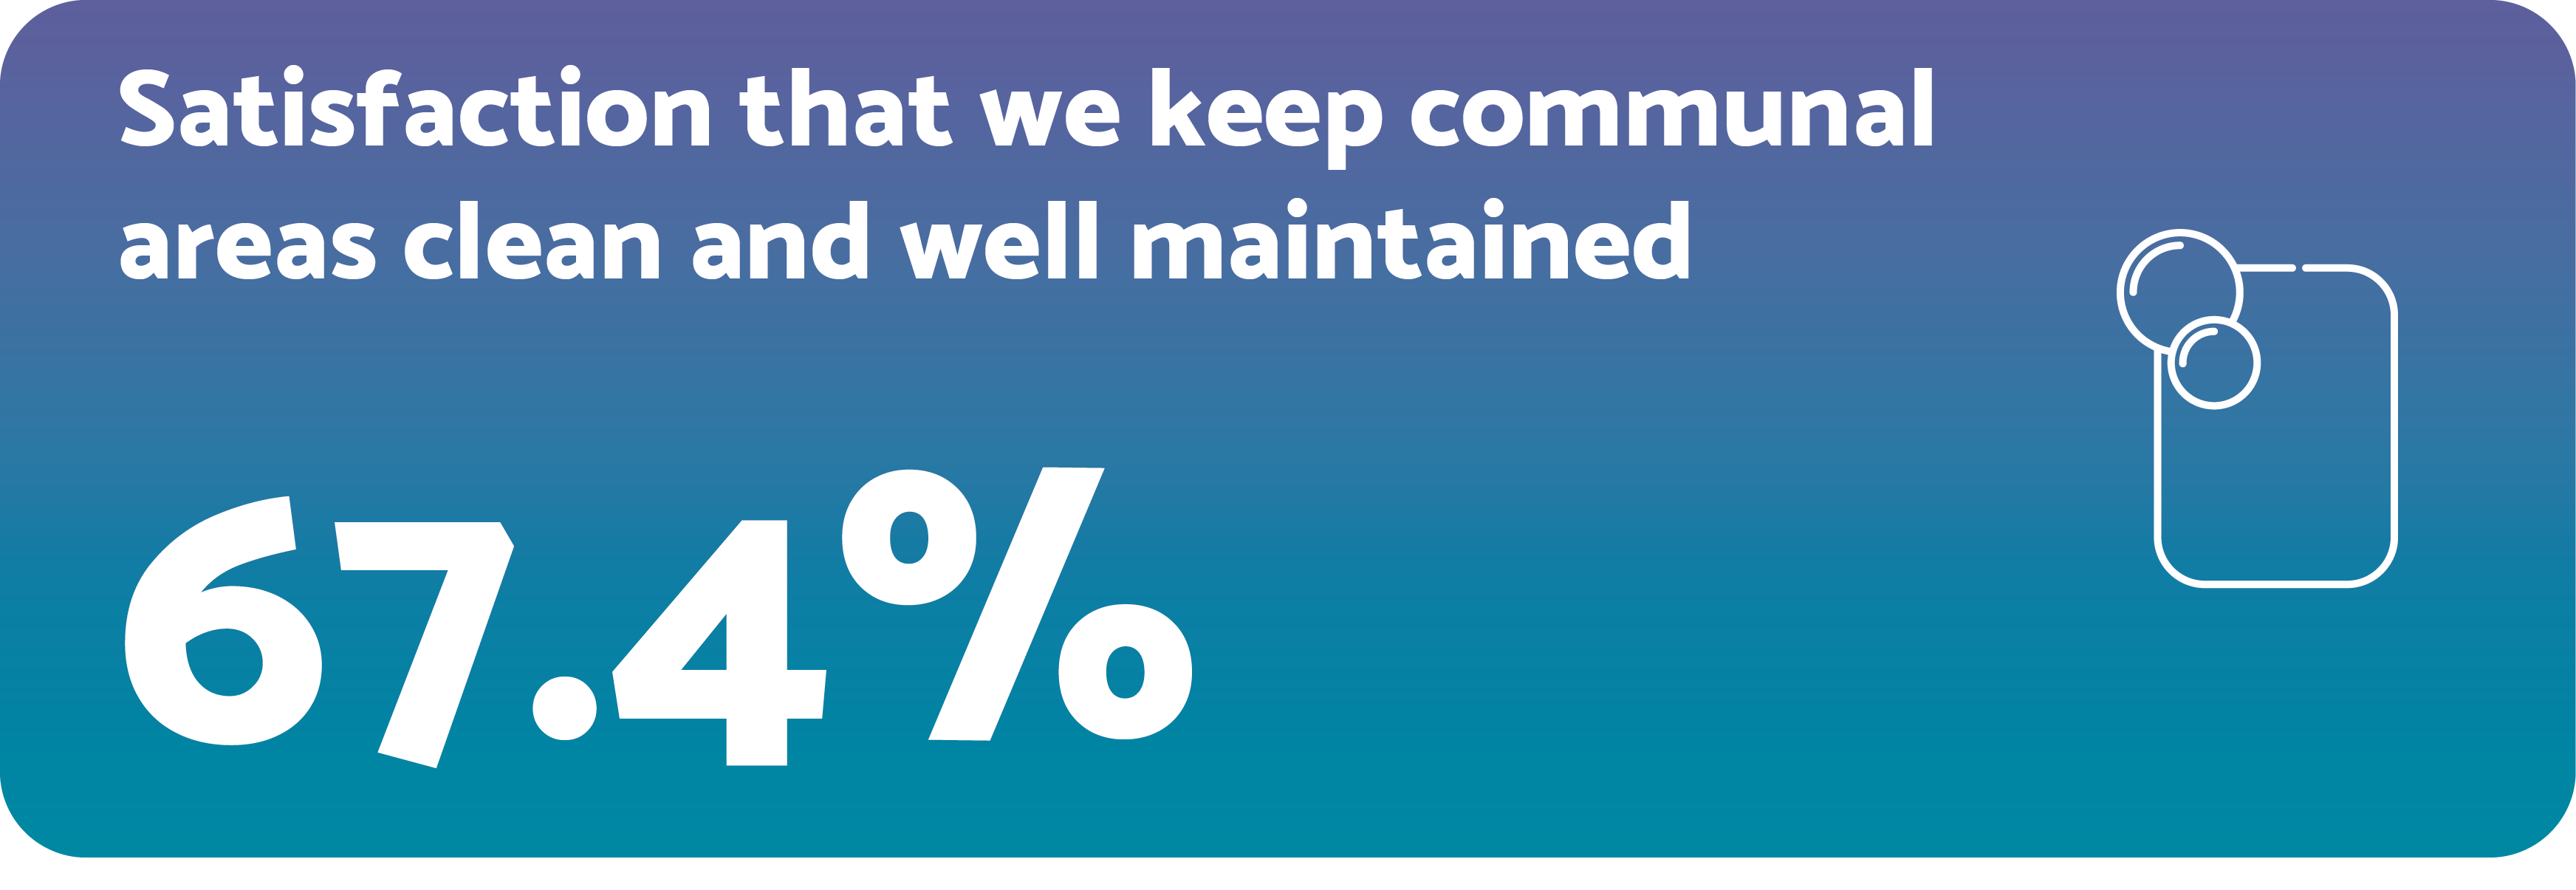
Communal areas -5.6%
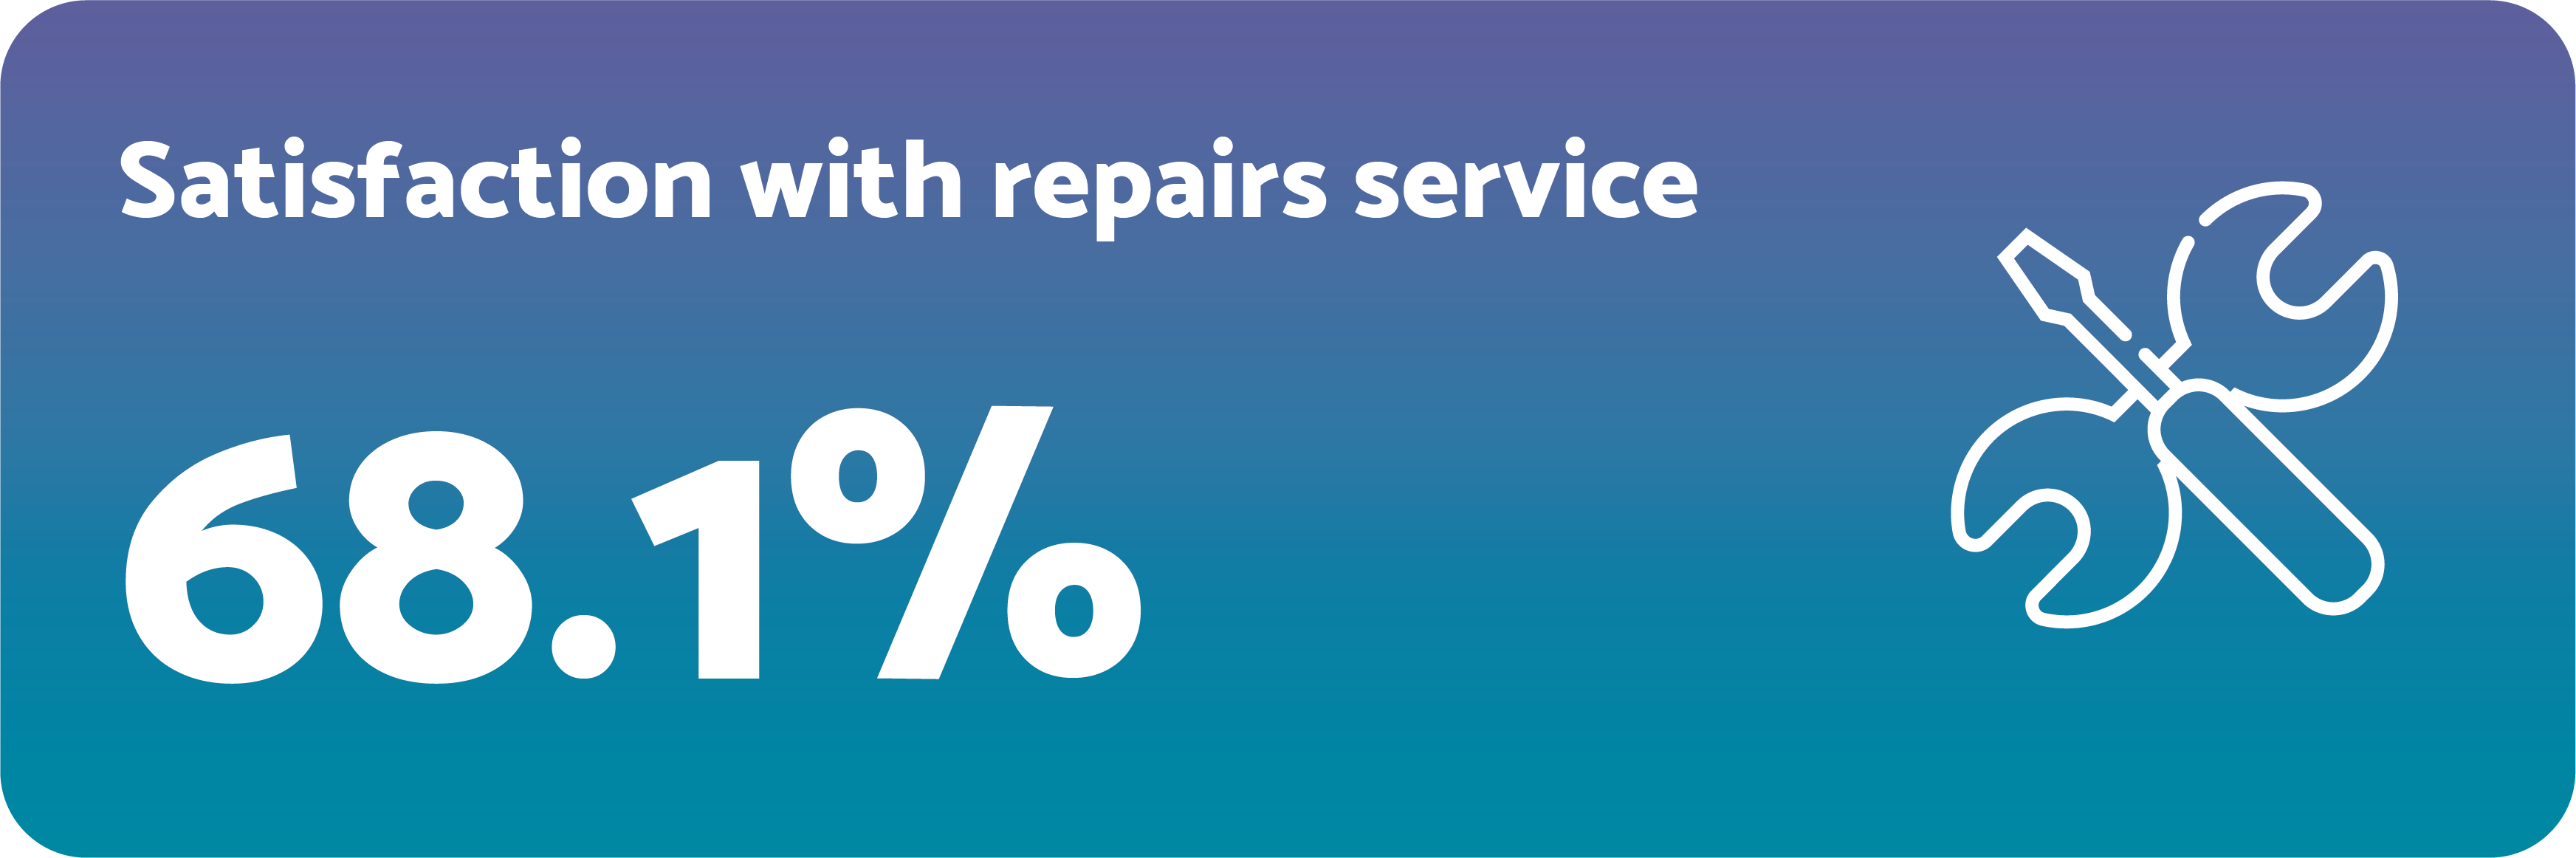
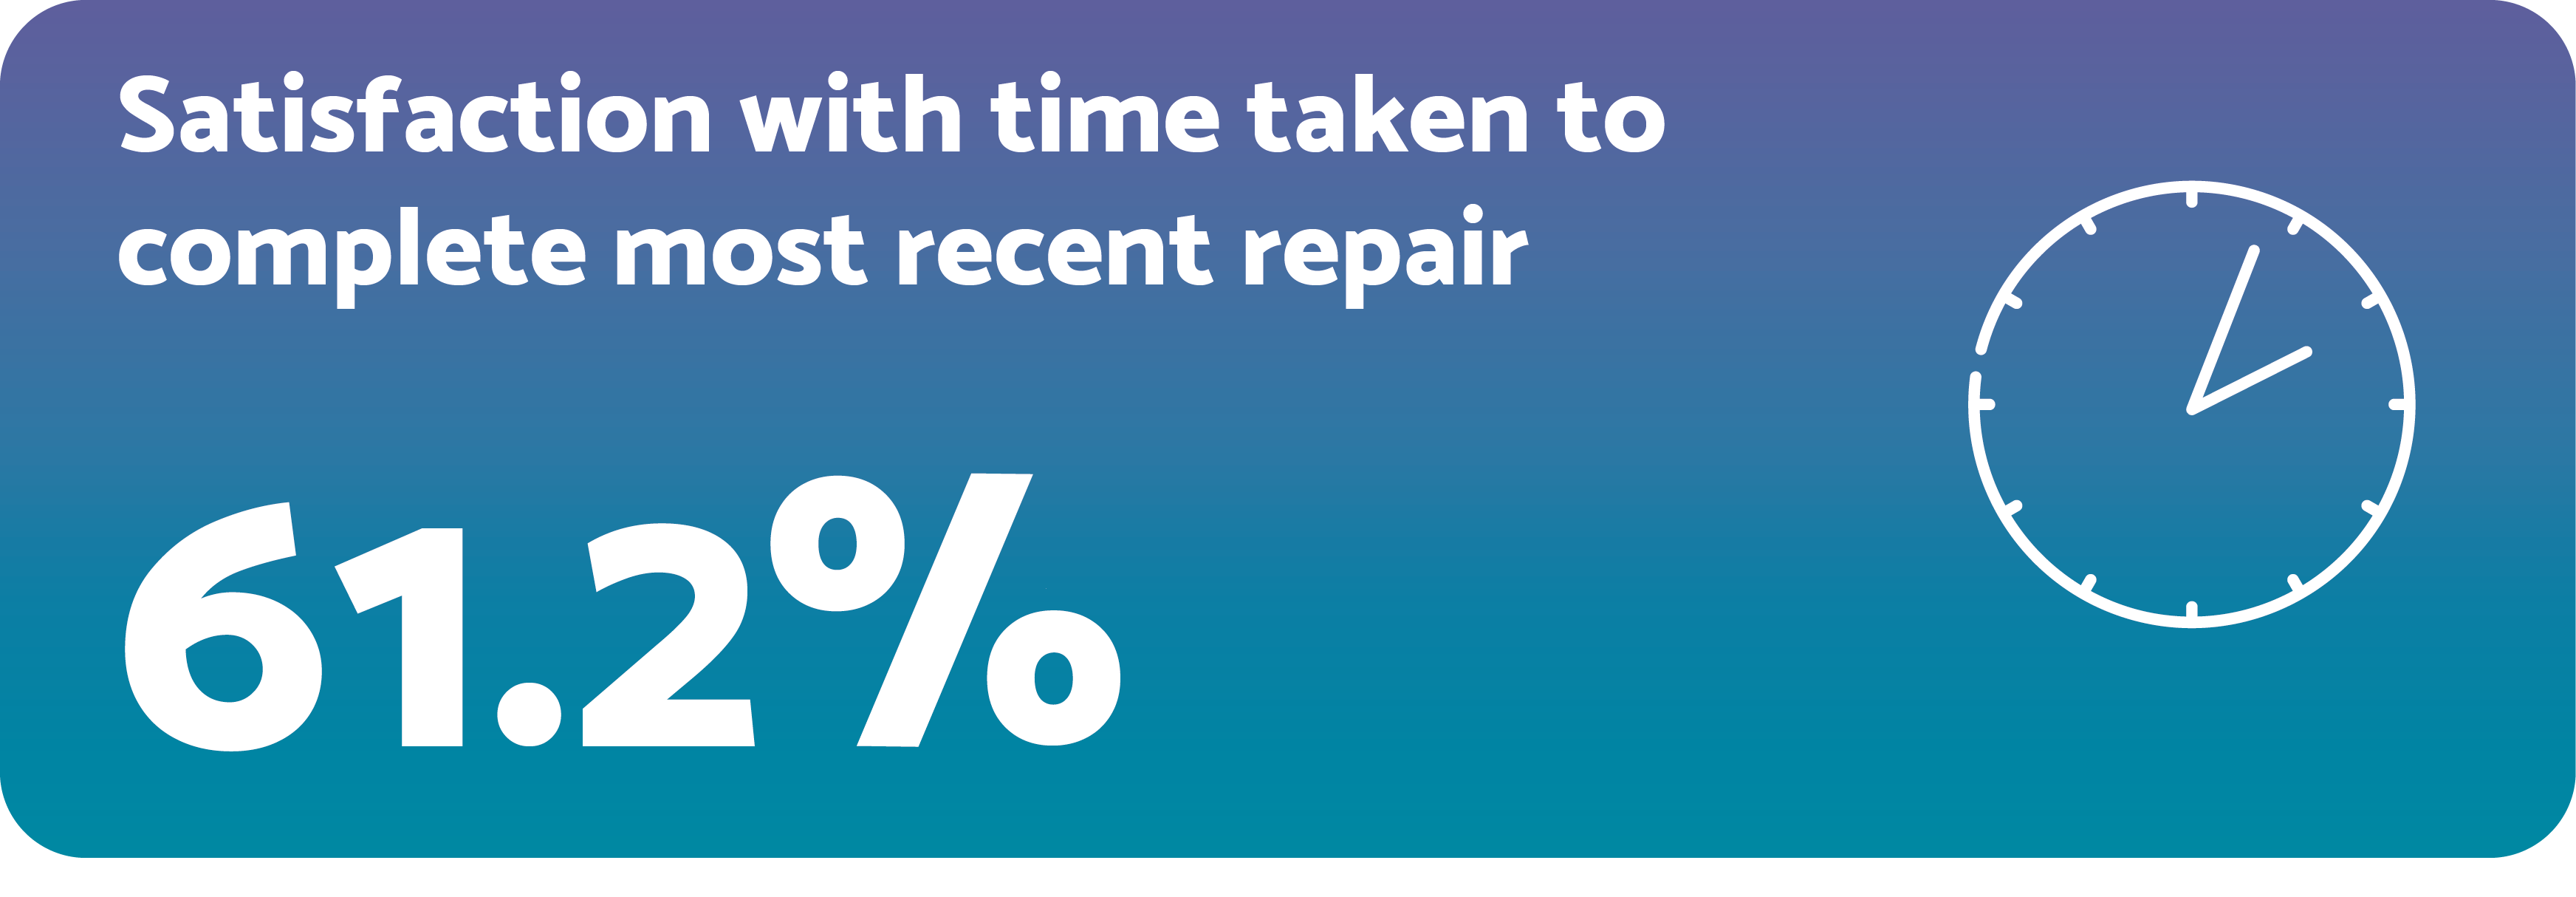
Time to complete repairs -3.8%
Repairs satisfaction -3.5%
Did different types of customers have different concerns?
Yes, they did. In response we’ve:
- Continued to hold Question Time events which are targeted to specific customer groups, so we can understand where we can make things better
- Carried out two in-depth scrutiny events and invited all of our customers to attend
- Introduced a ‘Love your Neighbourhood’ initiative for customers to improve local spaces and get people together to improve their environment
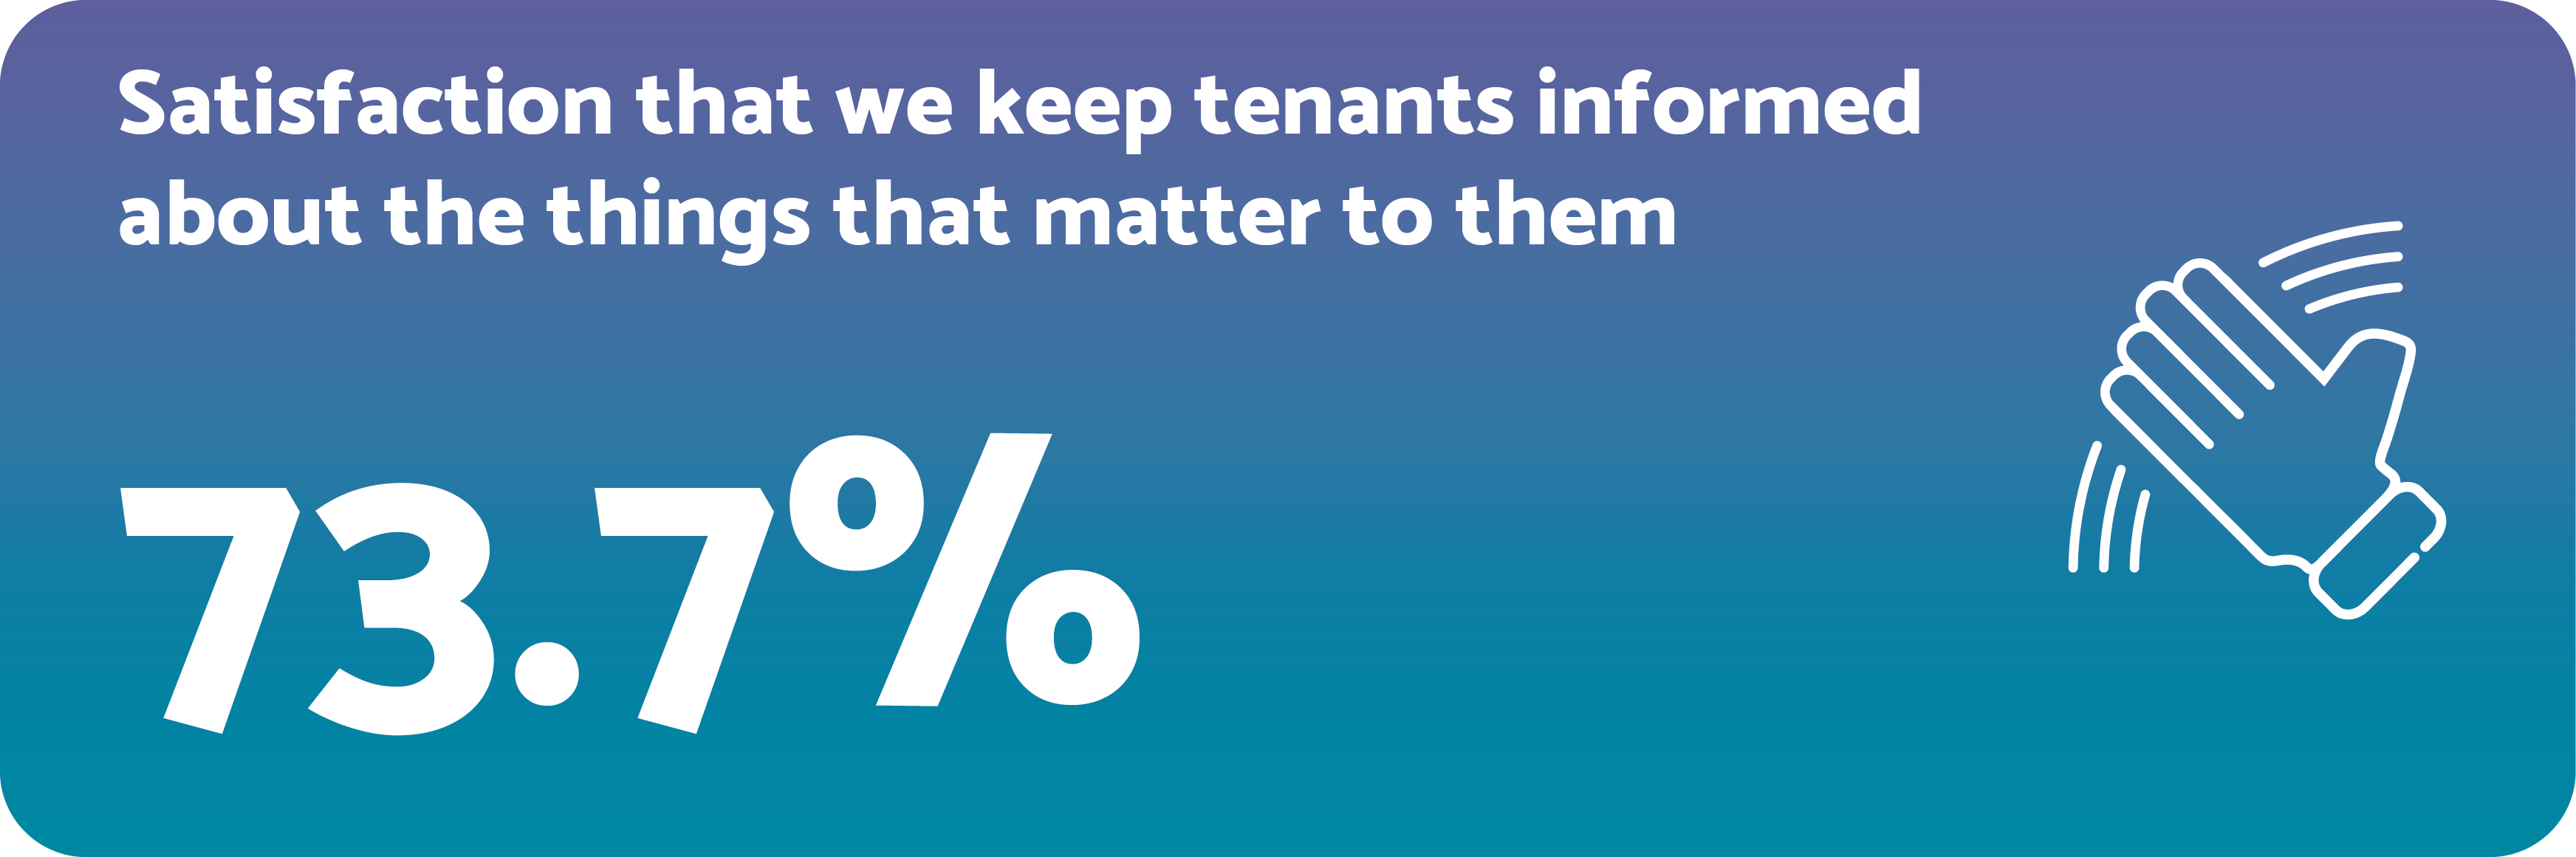
- Sent more communications about issues that affect individual blocks so that customers are updated about things that matter to them
How can I find out how Watford Community Housing compared to other landlords?
Every landlord should be publishing their results on their website.
If you are thinking of moving to another landlord, including through a mutual exchange, you should be able to request information about how they carried out their surveys, their results and their plans to improve.
What are we doing to improve?
- We provide a range of opportunities for our customers to get involved and ensure their voice is heard.
- We hold regular estate inspections and support local community groups with grants as well as practical support from our team.
- We have five community hubs and a network of scheme lounges that are used for a variety of events.
- Our Financial Inclusion team has helped residents to improve their finances by a combined value of £1,281,325.45. This is the first time we have surpassed £1 million in a 12-month period.
- We work with stakeholders and partners to obtain additional funding for our neighbourhoods. This year we’ve been successful with bids to the Household Support Fund for Watford and Three Rivers, and the Community Infrastructure Levy Grant from Watford Borough Council.
- Tackling fly-tipping remains a key priority for us and we created an action group to ensure we are taking proactive steps to address it. We’ve introduced a dedicated app to help staff log incidents.
- Three mobile cameras were set up to cover fly-tipping hotspots. Where fly-tippers have been identified they have been issued fixed penalty fines and warning notices.
- We work with the Community Safety Partnership and the Police.
- We’re working on gaining an accreditation from the Domestic Abuse Housing Alliance (DAHA) which will help us to support customers experiencing domestic abuse and improve our strategy to meet legal and regulatory requirements.
- Our Neighbourhood Champions meet regularly with Accuro for communal cleaning, grounds maintenance and assisted gardening to complete joint scoring of our neighborhoods.
- We held skip days in some of our local communities so that customers could dispose of items from their communal areas or gardens.
- We have improved the decoration and flooring in communal areas in our blocks in Chiltern Pines after feedback from our shared ownership group.
- We worked with our Gateway Membership Team to submit an annual review of our complaint process to the Housing Ombudsman.
- Our Customer Feedback Policy and Procedure is in line with the Housing Ombudsman Code.
- We have hosted regular complaint investigation training sessions for managers.
- We provide managers with a weekly complaints and compliments report to progress complaints to resolution and review lessons learnt from customer feedback. We publish this for our customers every six months.
- Customers have told us that we have improved when it comes to resolving their query on the first call – averaging at 72.6% for first-time resolution over the past 6 months. We have also seen excellent scores in our Customer Service Officers being polite and knowledgeable at 96.4%.
- We have introduced a tracking system to ensure we are responding to customer enquiries in line with our service standards. We investigate every complaint about staff members through our feedback process and take appropriate action.
- Complaint-investigating managers call customers to understand their concerns. We are working with our customers to ensure our complaint responses meet any needs such as any disabilities or different languages, and also offer a customer advocacy service.
- Customer-facing staff record customer contact using a mobile housing app while on visits.
- We send out voice, our customer magazine, three times a year, and make sure it covers areas that customers have told us we need to improve on or give them more information about.
- We now send more targeted texts and emails to specific blocks to let customers know if there has been any disruption to services or if we are going to be visiting to undertake a communal repair.
- 81% of customers have engaged with our messages and surveys in the past 12 months.
- We gave tenants a platform - through Tenant Question Time events - to raise concerns directly. Topics tackled during 2024/25 included fly-tipping and dumped rubbish, getting back to our customers, and a special pre-Annual General Meeting session. We also hosted an additional TQT on rechargeable repairs, which influenced the approval of a new policy by our Gateway Membership Team.
- We completed 1,248 customer surveys.
- We stepped up our communications to make sure customers know how to get support with damp and mould concerns. We also began preparing for the introduction of Awaab’s Law, which will come into effect later this year and wil set timescales for landlords to deal with issue like damp and mould.
- During our Big Door Knock, we asked all customers if they had any issues with damp and mould and have made sure that we have inspected and dealt with any concerns.
- We have been working with our contractor, Lux, to install new smoke and carbon monoxide detectors, and we sent out information to all customers living in flats about the importance of fire safety.
- We have continued to make good progress on our programme of works to make customers’ homes warmer, more comfortable and more energy-efficient. We added a further 78 properties to the programme, including homes we have acquired from our recent stock transfers from Hendon Christian Housing Association and West Herts Homes.
- Our Gateway Membership Team (GMT) selected and led a customer scrutiny session in February 2024 on our repairs contractor services. We’ve also updated our complaint categories to clearly define a contractor’s complaint, so we can raise any performance issues with our contractors.
- We continue to work to address ongoing repairs and have increased our contractor base to keep completion times within target. Customers completing our post-repairs surveys told us that they were happier with the time taken to complete repairs, with satisfaction levels rising from 67.9% in the first half of 2024/25 to 84.3% at the end of the year.
- We are continuing to address our backlog of repairs and work towards meeting the timescales in our Responsive Repairs Policy, as well as improving communication with our customers.
- Based on the post-repair survey scores, we’ve also seen increased satisfaction with the time taken to complete repairs – from 64.2% to 73.8%. We acknowledge that we are slightly behind our key repair targets and have seen an increase in complaints relating to repairs, which we are using to understand where to target our resources.
- We have increased the number of surveys that we collect and took into account feedback from 3,055 interactions about our services.
- We contact all customers that have requested a call about dissatisfaction with our services and ask them how we can put things right.
- We know that repairs are the most important thing to our customers. We sent everyone a letter with information on repairs and our current wait times for different jobs. It explained what to do if you have a repair outstanding, how we are improving our services, what to do if you have damp and mould in your home, and what support we can offer if you need a little extra help with areas like finances.
- We have been recruiting to our Repairs team across all trades to help us carry out repair jobs more quickly.
- We update our website frequently to reflect our current timescales for different types of repair.
- We’ve been working to address customer complaints and concerns around repairs, and to prioritise accordingly.
- We undertook a scutiny of our repairs contractors and have an action plan to improve how they communicate with our customers regarding appointments.
Performance management scores
The below shows how we performed on the 10 management performance measures in 2024/25:
CH01 (1)
Number of stage one complaints received per 1,000 homes - 24.9
CH02 (1)
Proportion of stage one complaints responded to within the Housing Ombudsman’s Complaint Handling Code timescales - 100%
NM01 (1)
Number of anti-social behaviour cases opened per 1,000 homes - 14.9
RP01
Proportion of homes that do not meet the Decent Home Standard - 0.2%
RP02 (2)
Proportion of emergency responsive repairs completed within landlord’s target timescale - 95.4% against a target of 24 hours
BS02
Proportion of homes for which all required fire risk assessments have been carried out - 99.9%
BS04
Proportion of homes for which all legionella risk assessments have been carried out - 98.9%
CH01 (2)
Number of stage two complaints received per 1,000 homes - 5.3
CH02 (2)
Proportion of stage two complaints responded to within the Housing Ombudsman’s Complaint Handling Code timescales - 100%
NM01 (2)
Number of anti-social behaviour cases that involve hate incidents opened per 1,000 homes - 0.7
RP02 (1)
Proportion of non-emergency responsive repairs completed within landlord’s target timescale - 58.8%against a target of 20 working days for responsive repairs and 7 days for urgent repairs
BS01
Proportion of homes for which all required gas safety checks have been carried out - 100%
BS03
Proportion of homes for which all asbestos management surveys or re-inspections have been carried out - 86.3%
BS05
Proportion of homes for which all required communal passenger lift safety checks have been carried out - 100%